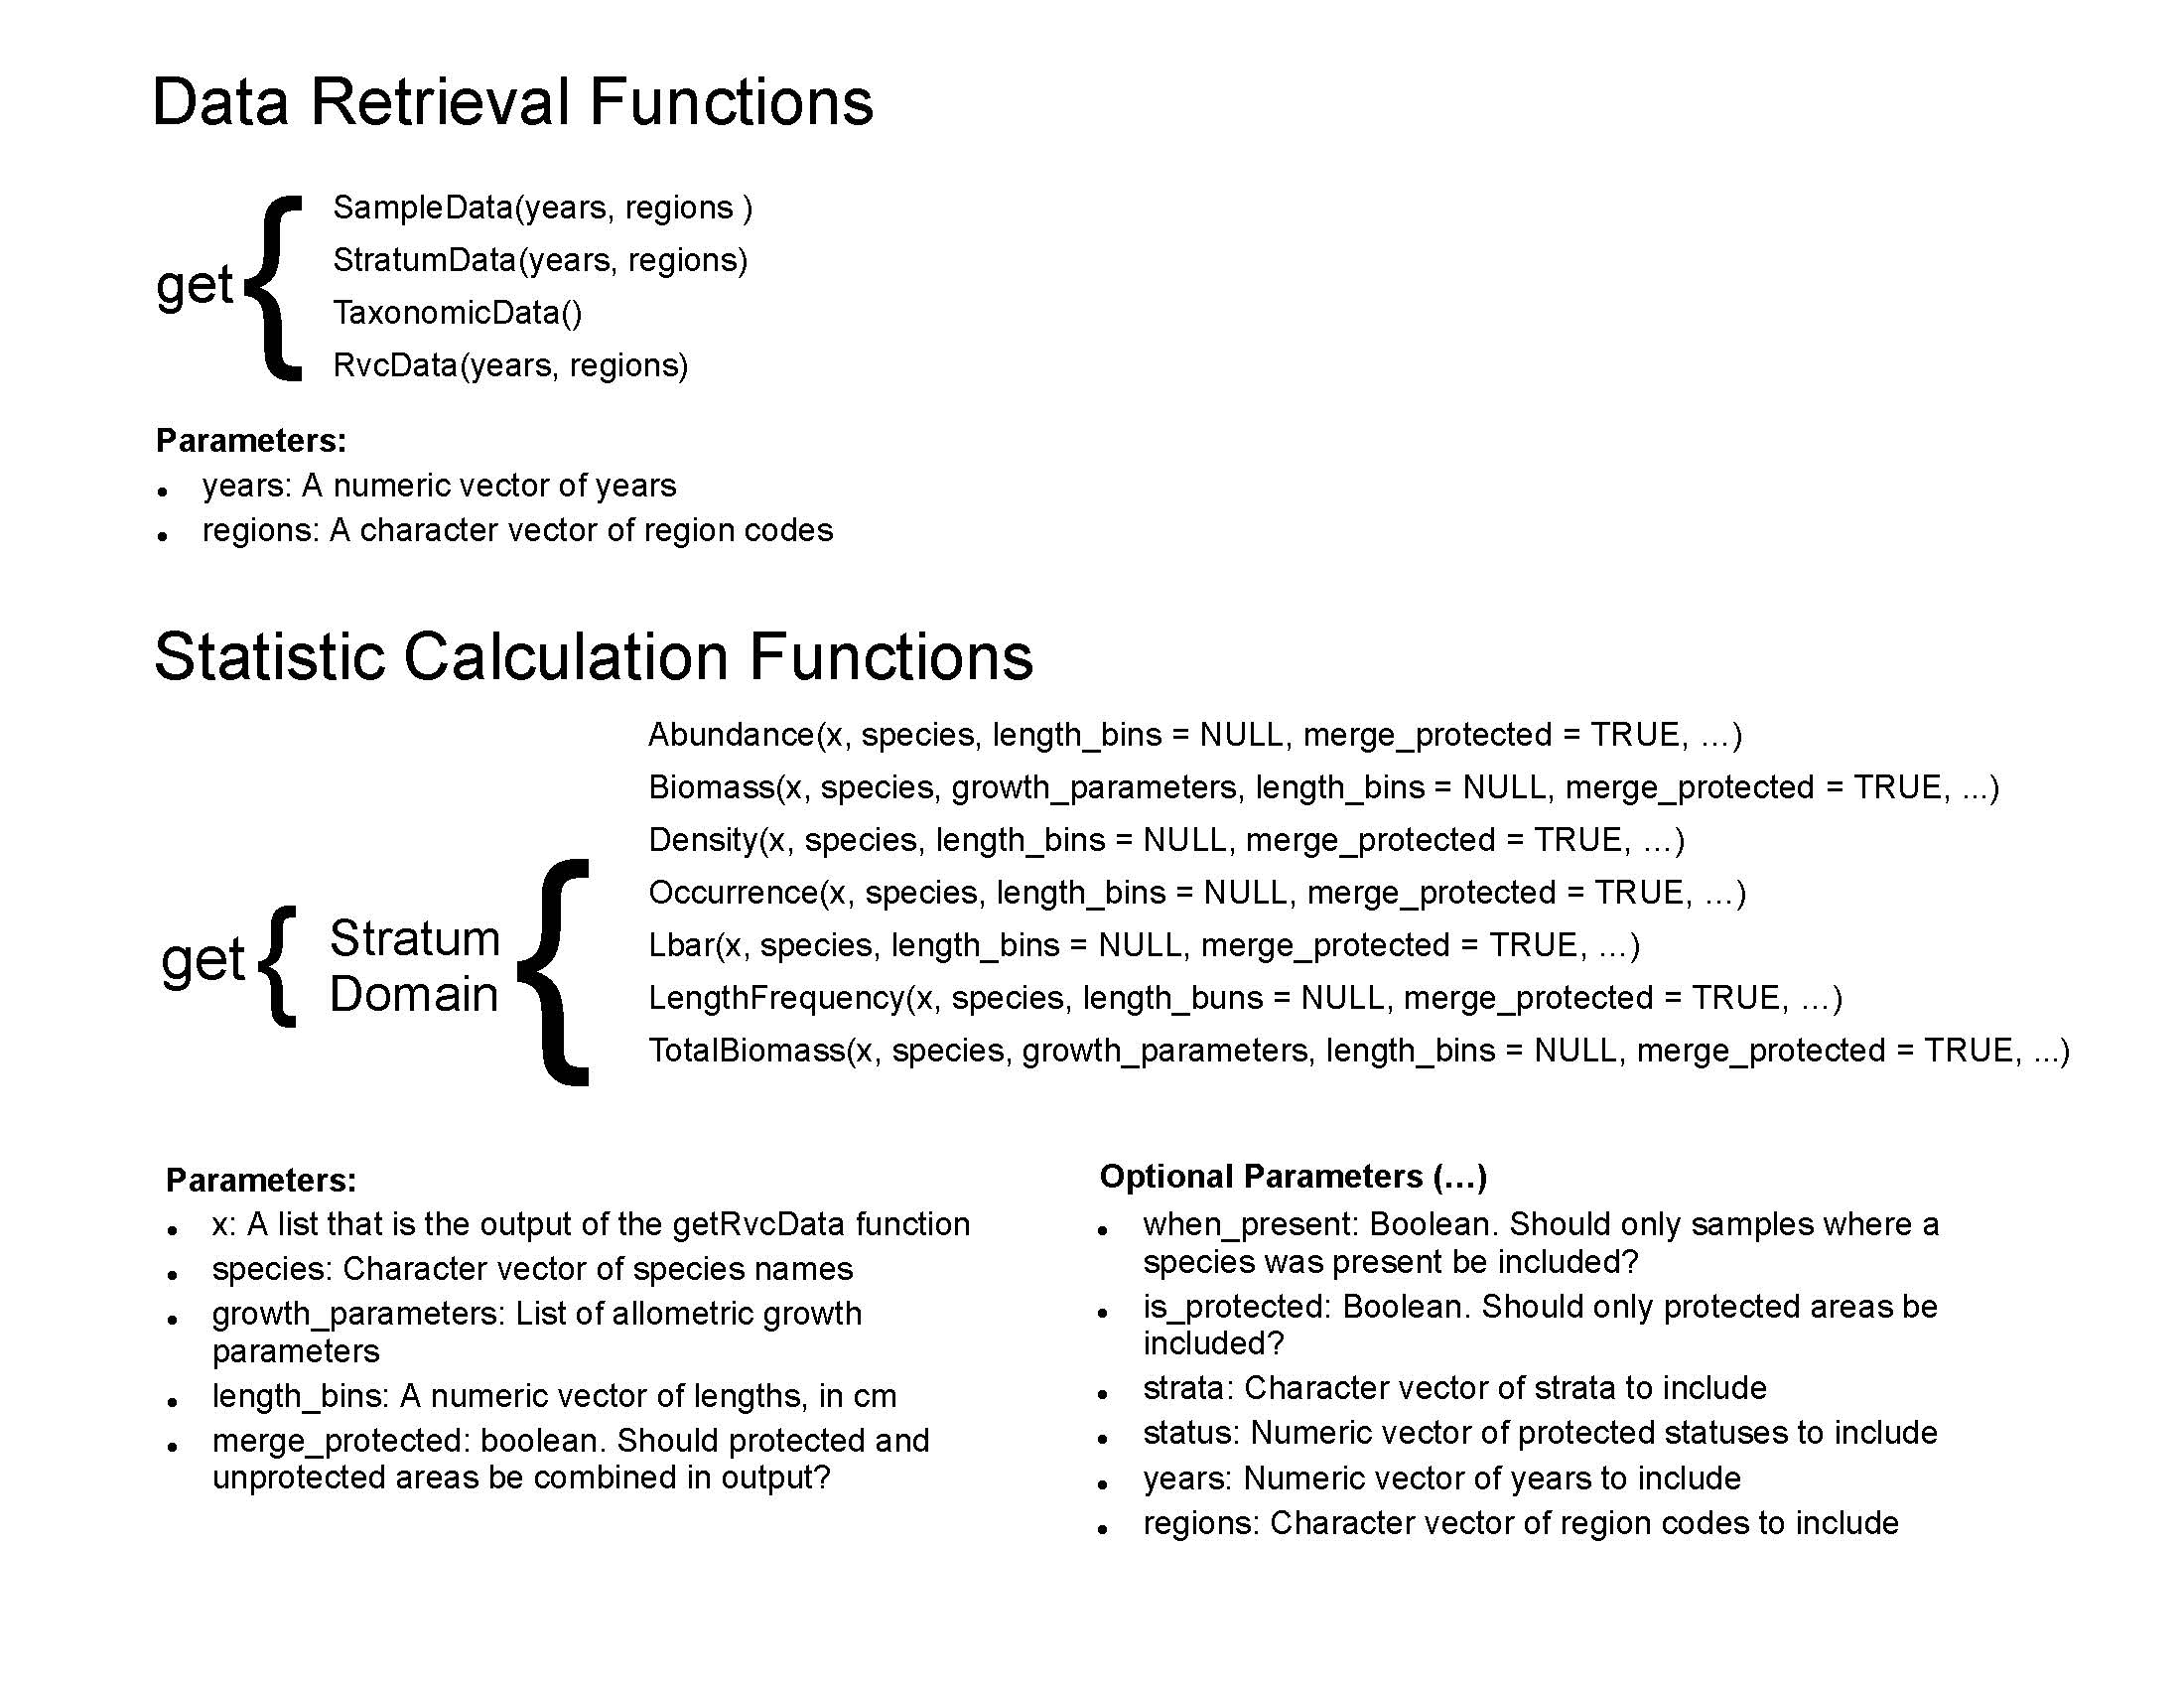
The diagram below shows the relationship between the get... functions and the various optional parameters that can be used to filter the data.
Required Parameters
All metric calculation functions have two required parameters that must be passed arguments:
x: The data object returned from the getRvcData() function. This is a list containing sample_data, stratum_data, and taxonomic_data.
species: A character vector indicating the species to be analyzed. This can be a single species code (e.g., "ocy chry"), a common name, a scientific name, or a list of multiple species (e.g., c("ocy chry", "spa viri")).
Optional Parameters
The following optional parameters can be used to filter the data and customize the output of the analysis functions.
Metric-Specific Parameters
growth_parameters: A list of allometric growth parameters (a and b values) used for length-weight conversion. This is required for biomass calculations (get...Biomass, get...TotalBiomass). If not provided, the function will use the default parameters included in the package.
length_bins: Any statistic in the rvc package can be calculated for length classes or in length bins by providing the length_bins option.
You have three options in calculating length specific statistics:
You can use keywords “lc” and “lm” to calculate statistics above and below the minimum length-at-capture and length-at-maturity, respectively, assuming the values are available in the database.
You can pass in your own number or sequence of numbers which will serve as breakpoints, in cm, above, below, and between which the statistic will be calculated for all species in the species argument combined. This is the most useful when binning data.
You can pass in a custom lookup table with species names and breakpoints (in cm) for each species. The lookup table will be used to calculate the statistic above and below the breakpoint for each species separately.
NOTE: Only option 2 can be used in the get...LengthFrequency functions.
WARNING: The variance associated with data in small length bins could be large and/or misleading.
General Data Filters
These parameters filter the dataset before metrics are calculated.
regions: A character vector of region codes to include in the analysis. For example c("FLA KEYS", "DRY TORT").
strata: A character vector of stratum codes (e.g., "FK01" or c("FK01", "FK02", "FK03")) to include. This is useful for focusing on specific stratum.
years: A numeric vector of years to include in the analysis (e.g., 2018:2022 or c(2018, 2020)).
status: A numeric vector of protected status codes to include.
is_protected: A boolean (TRUE or FALSE). If TRUE, only data from protected areas will be included. If FALSE, only data from unprotected areas will be included.
when_present: A boolean (TRUE or FALSE). If TRUE, the analysis will only include samples where the specified species was actually present. This is useful for calculating metrics like mean length only for the fish that were observed, rather than across all samples.
merge_protected: A boolean (TRUE or FALSE). If TRUE (the default), the output will combine data from protected and unprotected areas. If FALSE, the output will provide separate rows for protected and unprotected areas.
Grouping Species
Use the group parameter to calculate metrics like abundance or biomass for a collection of species, such as those within the same genus, family, or trophic group. To calculate metrics in a group you need to pass in a dataframe to the group parameter. For example, you could create a dataframe that groups species into snappers, parrotfish, and grunts:
# Create a dataframe to group speciesgroup_df <-data.frame(SPECIES_CD =c("ocy chry", "lut gris", "lut apod", "spa auro", "spa viri", "hae plum", "hae auro"),group =c("snapper", "snapper", "snapper", "parrotfish", "parrotfish", "grunt", "grunt"))print(group_df)
  SPECIES_CD      group
1   ocy chry    snapper
2   lut gris    snapper
3   lut apod    snapper
4   spa auro parrotfish
5   spa viri parrotfish
6   hae plum      grunt
7   hae auro      grunt
Then pass this dataframe into the ‘species’ and ‘group’ parameters of another package function as follows…Please note the syntax when passing to the species parameter (vector) is different than passing to group parameter (dataframe)
# Pass the group_df to another functiongroup_density <-getDomainDensity(FKEYS2024, species = group_df$SPECIES_CD, group = group_df)print(group_density)
  YEAR   REGION      GROUP  density       var   n nm      N      NM STAGE_LEVEL
1 2024 FLA KEYS      grunt 12.86026 3.3999443 622 NA 184717 2613211           1
2 2024 FLA KEYS parrotfish  8.16819 0.1012411 622 NA 184717 2613211           1
3 2024 FLA KEYS    snapper  8.42520 0.5887611 622 NA 184717 2613211           1